Zero Pulse
Putting no- and low-alcohol drinks first on a menu could reduce alcohol orders

By Anthony
To begin
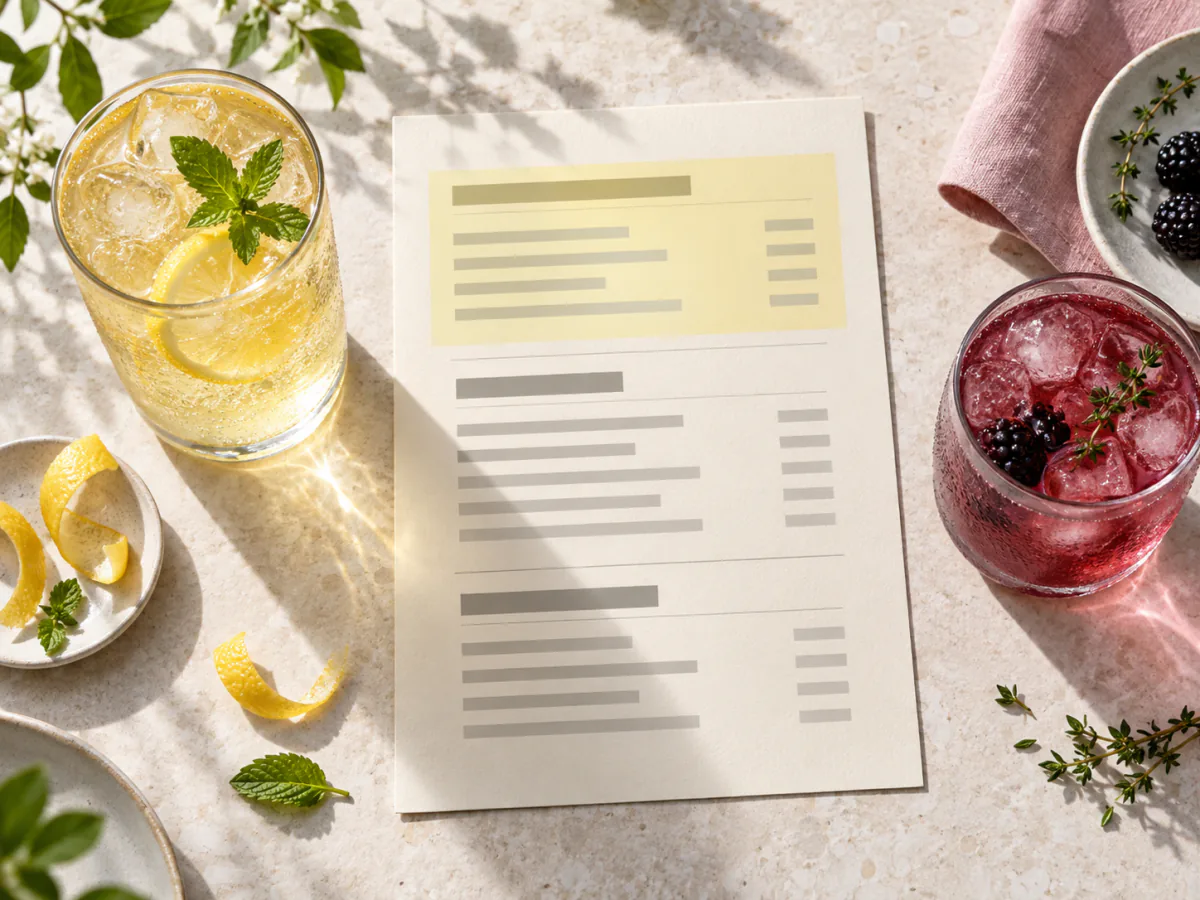
When a menu features a separate section for non-alcoholic or low-alcohol drinks, a customer who only reads the beer section might overlook these options. A randomised experiment conducted in the UK, Germany, and Mexico tested what happens when the dedicated section is moved to the first position and these options—known as "no and low alcohol" or NoLo—also appear at the top of the alcoholic beverage categories.
In this digital simulation, participants ordered less alcohol, with no difference in average spending detected. This result relates to a hypothetical order: the experiment did not track actual purchases, consumption at the bar, or whether the choice was repeated over time.
More prominent placement reduced simulated alcohol orders in all three countries
The Behavioural Insights Team recruited and randomly assigned 11,487 participants: 3,795 in the UK, 3,912 in Germany, and 3,780 in Mexico. Each participant imagined a night out and ordered drinks from one of the randomly assigned menus. The quantity chosen was converted into millilitres of pure alcohol.
On the control menu, no- and low-alcohol drinks were listed in a separate section. In the "prominence" version, the NoLo section was moved to the first position. These options remained accessible in that section but also appeared at the very top of the alcoholic beverage categories, ahead of the alcoholic products. The result therefore reflects this combined presentation; it does not isolate the effect of the drink order within each category alone.
In the UK, this presentation reduced the average amount of alcohol ordered by 15% compared to the control menu—a reduction of 4.5 ml of pure alcohol. Participants were also 30% more likely to choose at least one NoLo drink. The reported effect pointed in the same direction in Germany, with a reduction of 4.7 ml of pure alcohol, and in Mexico, with a reduction of 14.2 ml. According to the summary by the BIT team published by the Institute of Alcohol Studies, no difference in average spending was found in these three countries.
These figures were published by BIT. The published figure shows unadjusted 95% confidence intervals and indications of significance based on p-values adjusted for multiple comparisons. However, the numerical bounds of the intervals and the full statistical report are not provided. The layout may have changed which options people noticed first, but the reported results cannot establish that mechanism.
A wider choice in a separate section did not show the same reduction
The experiment compared several ways of presenting the same beverage categories. One menu retained the dedicated NoLo section while also integrating these options at the bottom of each category. Another increased the number of options but kept them in a separate area. The table below compares the control menu with three of the four tested variants.
Scroll the table to read all columns.
| Tested presentation | What the participant saw | Reported result |
|---|---|---|
| Separate section | NoLo options had to be sought in their own section | Control condition |
| Bottom placement | The NoLo section remained present, and its options also appeared after the alcoholic drinks in each category | Estimated decrease across the three countries, but too uncertain to rule out chance |
| More prominent placement | The NoLo section moved to the first position, and its options also came first in each category | Less alcohol ordered across the three countries |
| Expanded selection | More NoLo options, still in a dedicated section | No demonstrated reduction in alcohol ordered |
These results do not demonstrate that expanding choice is pointless. In this experiment, no decrease in the amount of alcohol ordered was demonstrated when more NoLo options were included in that section. The BIT report on substitution presents the layout—which places the NoLo section first and its options at the top of the categories—as a proof of concept to be tested in real-world settings.
The effect on actual purchases remains to be measured
These figures describe a hypothetical order placed online. Participants had to imagine a night out and then make a choice from a digital menu; the study did not observe their actual purchases or their actual consumption.
France was not among the three countries studied. The differences observed between the UK, Germany, and Mexico suggest that the findings should not be generalised directly. Applying the layout to a printed menu, a wall display, or a chalkboard remains to be tested. Prices, descriptions, availability, staff recommendations, and perceived quality can also influence choices in a real-world venue.
Finally, the results relate to a specific, one-off choice. They do not indicate whether the customer enjoys the drink, recommends it, returns to order it, or compensates later by consuming more alcohol. Highlighting these options guarantees neither that customers will continue to order them nor that they will consume less alcohol in real-world conditions.
A pub trial tested substitution rather than menu layout
Another study provides a real-world reference point, without testing the same mechanism. Published in 2024, this randomised crossover trial tracked 14 independent bars and pubs in the Bristol area. Data were collected from August to November 2022. A non-alcoholic draught beer temporarily replaced an alcoholic one, and each establishment alternated between intervention periods and normal operations over an eight-week period.
The primary unadjusted analysis estimated a 3% drop in the weekly sales volume of alcoholic draught beer, with a 95% confidence interval ranging from an 8% decrease to a 1% increase. The adjusted estimate across all 14 establishments showed a 4% decrease, with a range extending from an 8% decrease to a 0.1% increase. After excluding the four establishments that failed at least one protocol compliance check, the adjusted estimate for the remaining ten establishments showed a 5% decrease, with a range extending from an 8% decrease to a 0.8% decrease. Among the 11 establishments for which revenue data were available, no clear change in weekly revenue from all drinks was detected.
Estimates therefore suggest a decline in the sales volume of alcoholic draught beer; however, the primary unadjusted analysis and the adjusted estimate across all 14 establishments remain compatible with no decline. The impact on revenue also remains uncertain. Crucially, this trial does not prove that a more prominent menu placement would yield the same result: the intervention involved draught availability and simultaneously removed an alcoholic option.
Testing more prominent placement and tracking sales in France
For a bar, restaurant, or hotel, the experiment offers a simple hypothesis to test: maintain the dedicated section and place it first, while also positioning a relevant option at the top of each corresponding category. For a local test involving non-alcoholic drinks, the establishment could place a 0.0% beer at the top of the beer section, a non-alcoholic creation at the top of the cocktail section, and a sparkling alternative within the aperitif section, provided the product range allows for it. The BIT experiment focused on non-alcoholic and low-alcohol beverages; the results presented do not allow for isolating an effect specific solely to 0.0% products.
Over two comparable periods, the establishment can track units sold by category, the proportion of orders containing at least one non-alcoholic drink, the average spend per order, and out-of-stock incidents. Changes in pricing, product range, or staff recommendations must be noted. This monitoring remains exploratory: two comparable periods are not enough, on their own, to attribute a trend to the menu itself. Feedback on taste and menu clarity complements the sales data.
This approach involves checking whether an existing option is chosen more frequently when the "NoLo" (no- and low-alcohol) section and its options in each category are easier to spot. To assist the customer after that initial glance, the menu can describe drinks by profile (e.g., bitter, fruity, dry, or spicy) rather than simply highlighting the absence of alcohol. The guide to choosing a non-alcoholic drink by flavour and occasion links flavour profiles to specific consumption occasions.
The combined layout changed simulated orders. Its effect on real sales still needs to be measured.